2017 in review, and 2018 outlook
What sparked my interest in 2017, and what will raise my eyebrow in 2018?
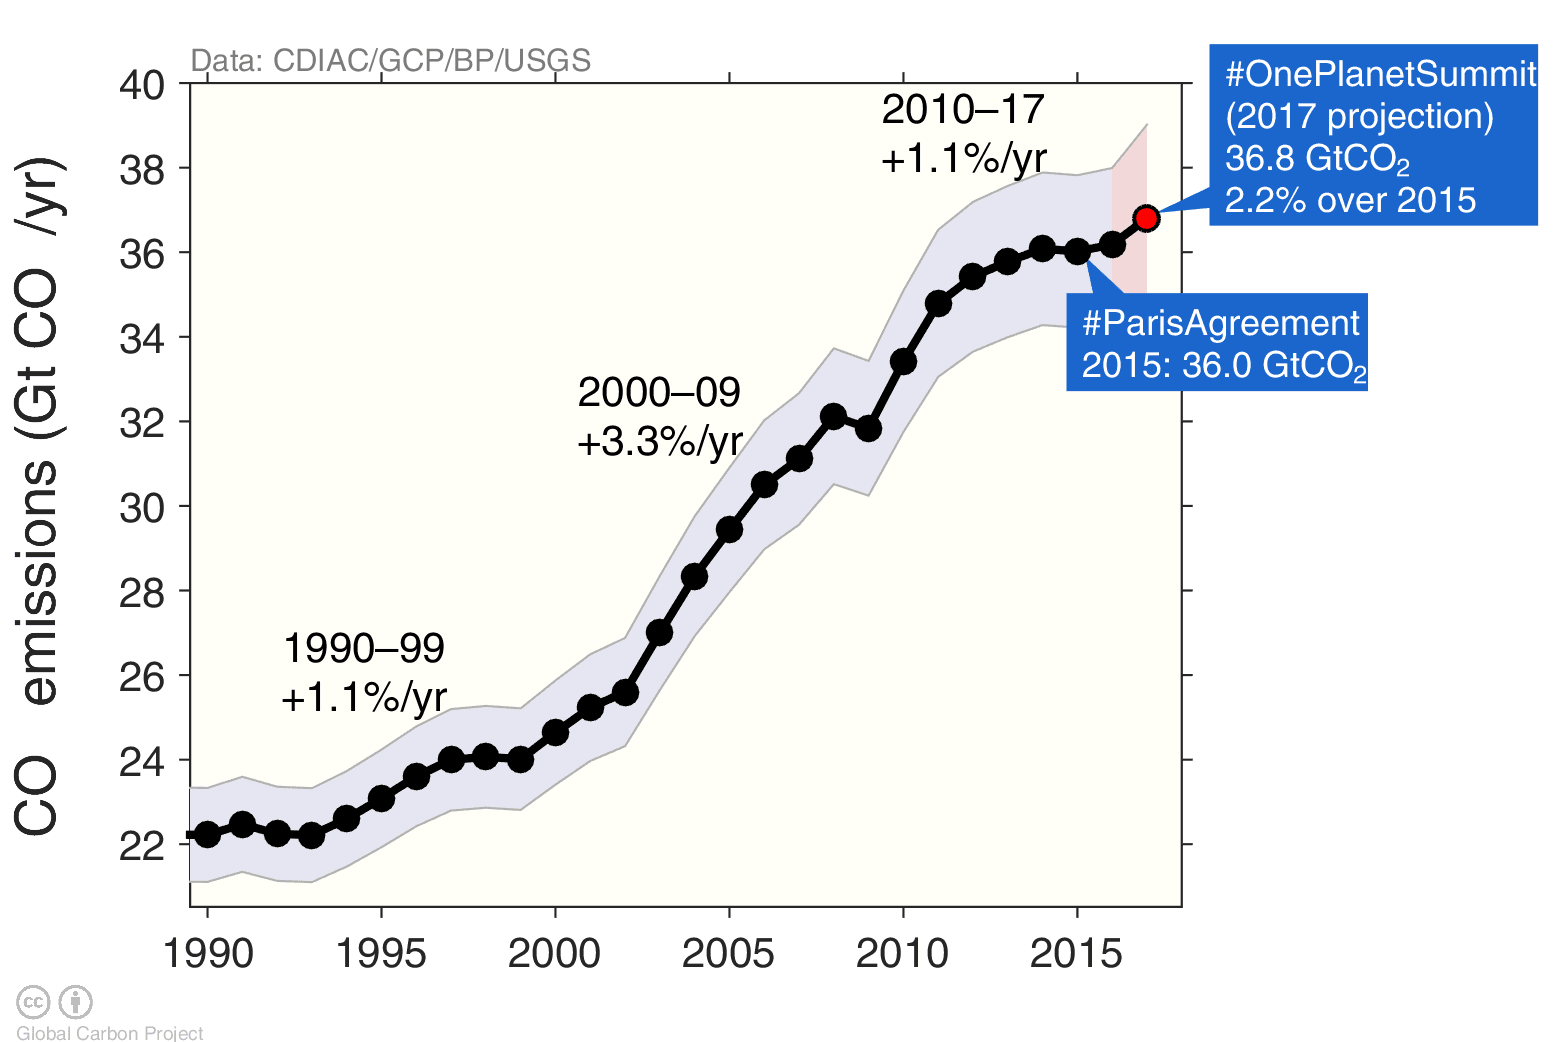
Global CO₂ emissions in gigatonnes CO₂ per year.
Record growth in renewables, electric vehicles, and battery storage. Record cost declines in clean technologies. New opportunities for climate leadership. Another big year for climate? And, global emissions went up 2%!
I always feel like the pessimistic party pooper, but we are so busy cheering on anything remotely positive that fossil fuels have scored yet another goal. Sorry to spoil the party, but we need to burn less fossil fuels to win the game!
The big news of 2017
In November, we predicted that carbon dioxide emissions may grow 2% in 2017. Perhaps 0.8%, perhaps 3%, either way, positive growth is likely.
We announced the increase in 2017 emissions during the Bonn climate conference, and a few weeks later, Emmanuel Macron hosted the One Planet Summit.
The One Planet Summit marked two years since the Paris Agreement, and it also marked a 2% increase in global emissions. Let’s look at the 2017 estimate in a longer term perspective.
The ups and downs in global emissions are still driven by external forces, with climate policy yet to leave an obvious mark on emission trends.
Back in the 1990s, we had three years with declining emissions (1991, 1992, 1993) and three years of flat emissions (1997, 1998, 1999), yet the average growth rate during the 1990s was 1.1% per year.
The 2000s grew at 3.3% per year, on the back of rapid growth in Chinese emissions. There was a slight hiccup in 2008, during the Global Financial Crisis, but that did not last long.
The Global Financial Crisis may look like a small speed hump in the long-term trend, but it may also have laid the foundations for sluggish growth in the global economy, and therefore lower emissions growth. We may still be experiencing the effects of the speed hump?
In the 2010s emissions flattened out, and were almost flat from 2014 to 2016. This flattening raised the prospect that we may have reached peak emissions (with a question mark), but now that prospect seems to be diminishing.
Rather intriguingly, if our 2017 projection holds, then emissions growth in the 2010s will be 1.1% per year, the same as in the 1990s. Yes, the 2010s are slower than the 2000s, but it may be that the 2000s were remarkable and the 2010s are unremarkable!
Total global emissions in one year, while an important headline, misses the more interesting details. It is the details that tell the story of 2017, and indicate where the big news will be for 2018.

Renewables growing, coal in decline, and the elephant in the room
Breaking the global total down is key to understanding the drivers of change.
Coal may have peaked, something the IEA did not foresee, nor did anyone else, to be frank.
The IEA has not been so popular on renewables either. Solar and wind continue to grow strongly, and the renewables community is having a field day picking on the IEA. The tide will turn, one day, but not in 2017.
Meanwhile, out of sight, out of mind, emissions from oil and gas continue to grow on trend. Maybe the IEA got something right? But did the IEA predict the 2014 oil price declines? And what happened to the golden age of gas?
It is always easy fodder to pick on someone’s scenarios?, but my rather subtle “elephant in the room” is not understanding the cause of changes.
Why has coal gone down in the last three years?
You could draw a long-bow, and use correlation to link the declines in coal to growth in renewables or concerns about air pollution in developing countries, or the concerted effort by environmentalists to keep coal in the ground.
The coal story is really a China story, and the China story is really an economic story, and the economic story is that China has built all it needs to build for some time. Wind, solar, and air pollution helped, no doubt, but don’t mix correlation with causation.

Have the EU and US turned?
The changes in the country level are always fascinating, as is trying to predict who will win the emissions tug-of-war.
What will the big emitters do in 2017?
The China wildcard. The unexpected boom of the 2000s, the unexpected decline in the 2010s, and who knows where it is going next? A plot of IEA projections for China, somewhere lost on my computer (but found on Robert Wilson’s), is nothing to be proud about. No one predicted the ups and downs of China. The 2017 blip, if it is realised, was probably a result of economic stimulus, not a long-term trend. China will remain a wildcard, but I tentatively predict flat(ish) emissions in the next years.
The USA under Trump. Trump is winding back climate policies, but we would probably be a little naive to assume Clinton would have done much progressive on climate with a hostile Congress. The US Energy Information Agency predicts US emissions to rise 1.8% in 2018 (December update). Is this potential increase driven by Trump, or a return to stronger economic growth?
The EU applies the breaks. The world’s climate leader has had four years of flat emissions! Pardon? Official data stops in 2015, and one strength of the Global Carbon Budget, is that you get an extra two years of data! Hey climate hawks, stop boasting about cost declines in renewables, and start asking the EU what is happening…
An Indian pause. Emissions have risen slower in India then the decadal trend. Great news for climate, but perhaps misery for the economic upheavals Indians have had to endure. A surprise to many, coal grew strongly in India, the slower growth was mainly due to oil and cement. Don’t expect the lower growth to last long, and 2018 will probably signal a return to 5% per year growth.

Carbon dioxide removal
For some reason, 2017 was the year everyone started talking about carbon dioxide removal. Is this a good thing or not? I think it is great, we need to get the scientific community, integrated assessment modellers, and policy makers discussing this issue.
Will 2018 be the year of Solar Radiation Management?
CO₂ removal is the rage these days. Need some weekend reading?
* https://t.co/NcF5ojJYum
* https://t.co/w4rcPvp0Eh
* https://t.co/8us49lKTm1
* https://t.co/I5Iw3xQShN
* https://t.co/bMUvXWVsaO
* Or listen to @TransitionShow https://t.co/z6iZnBFBUs— Glen Peters (@Peters_Glen) 16. desember 2017
What will 2018 bring?
It could bring much embarrassment. As official data starts to trickle in during 2018, we will learn if our 2017 estimate was robust. The first data comes in late February from China, then BP in June.
As the new data trickles in, we will also get an idea of what emissions will do in 2018. What will happen in the key emitters, and how will the emissions tug-of-war between emission declines and increases play out?
The UNFCCC will have a big year, with the Talanoa (Facilitative) Dialogue, a precursor to the five-yearly Global Stocktakes under the Paris Agreement. The Global Stocktakes are meant to expose gaps in ambition, and remedy them with increases in ambition. Current ambition is nowhere near the required ambition, but if the stocktakes don’t remedy the emissions gap, at least partially, then the Paris Agreement has achieved very little. If the Talanoa Dialogue does not deliver, faith in the Paris Agreement may begin to fade in 2018.
The IPCC Special Report on 1.5°C will come in October, just before the second phase of the Talanoa Dialogue. The negotiation of the Summary for Policy Makers will surely be politically charged, and media attention high. A recent paper suggested the remaining carbon budget for 1.5°C was much bigger than previously thought, but will this become the new IPCC consensus? (I would say no). Will the IPCC provide clarification on what the Paris Agreement means, or will this remain vague? Will the IPCC discover new pathways to 1.5°C, or just solidify what we already know? So many questions, but will the IPCC Special Report on 1.5°C provide the answers?
My new year’s wish? That we focus more on policies that reduce emissions, not just policies that subsidise new technologies. The latter is needed, but the former is essential.
For sure, 2018 will be a big year for climate nerds!